Know exactly where to invest
in US retail real estate.
Institutional-grade real estate intelligence for independent investors. Deep market analysis, deal evaluation, and portfolio tracking — for any US zip code.
Free plan available · No credit card required
Top yield found
15.97% · Deerfield Beach, FL
26,000+
US markets tracked
15+
Data points per market
10 years
Historical data depth
Monthly
Data refresh cycle
Everything an investor needs
Five tools in one platform — from market discovery to deal analysis to portfolio tracking.
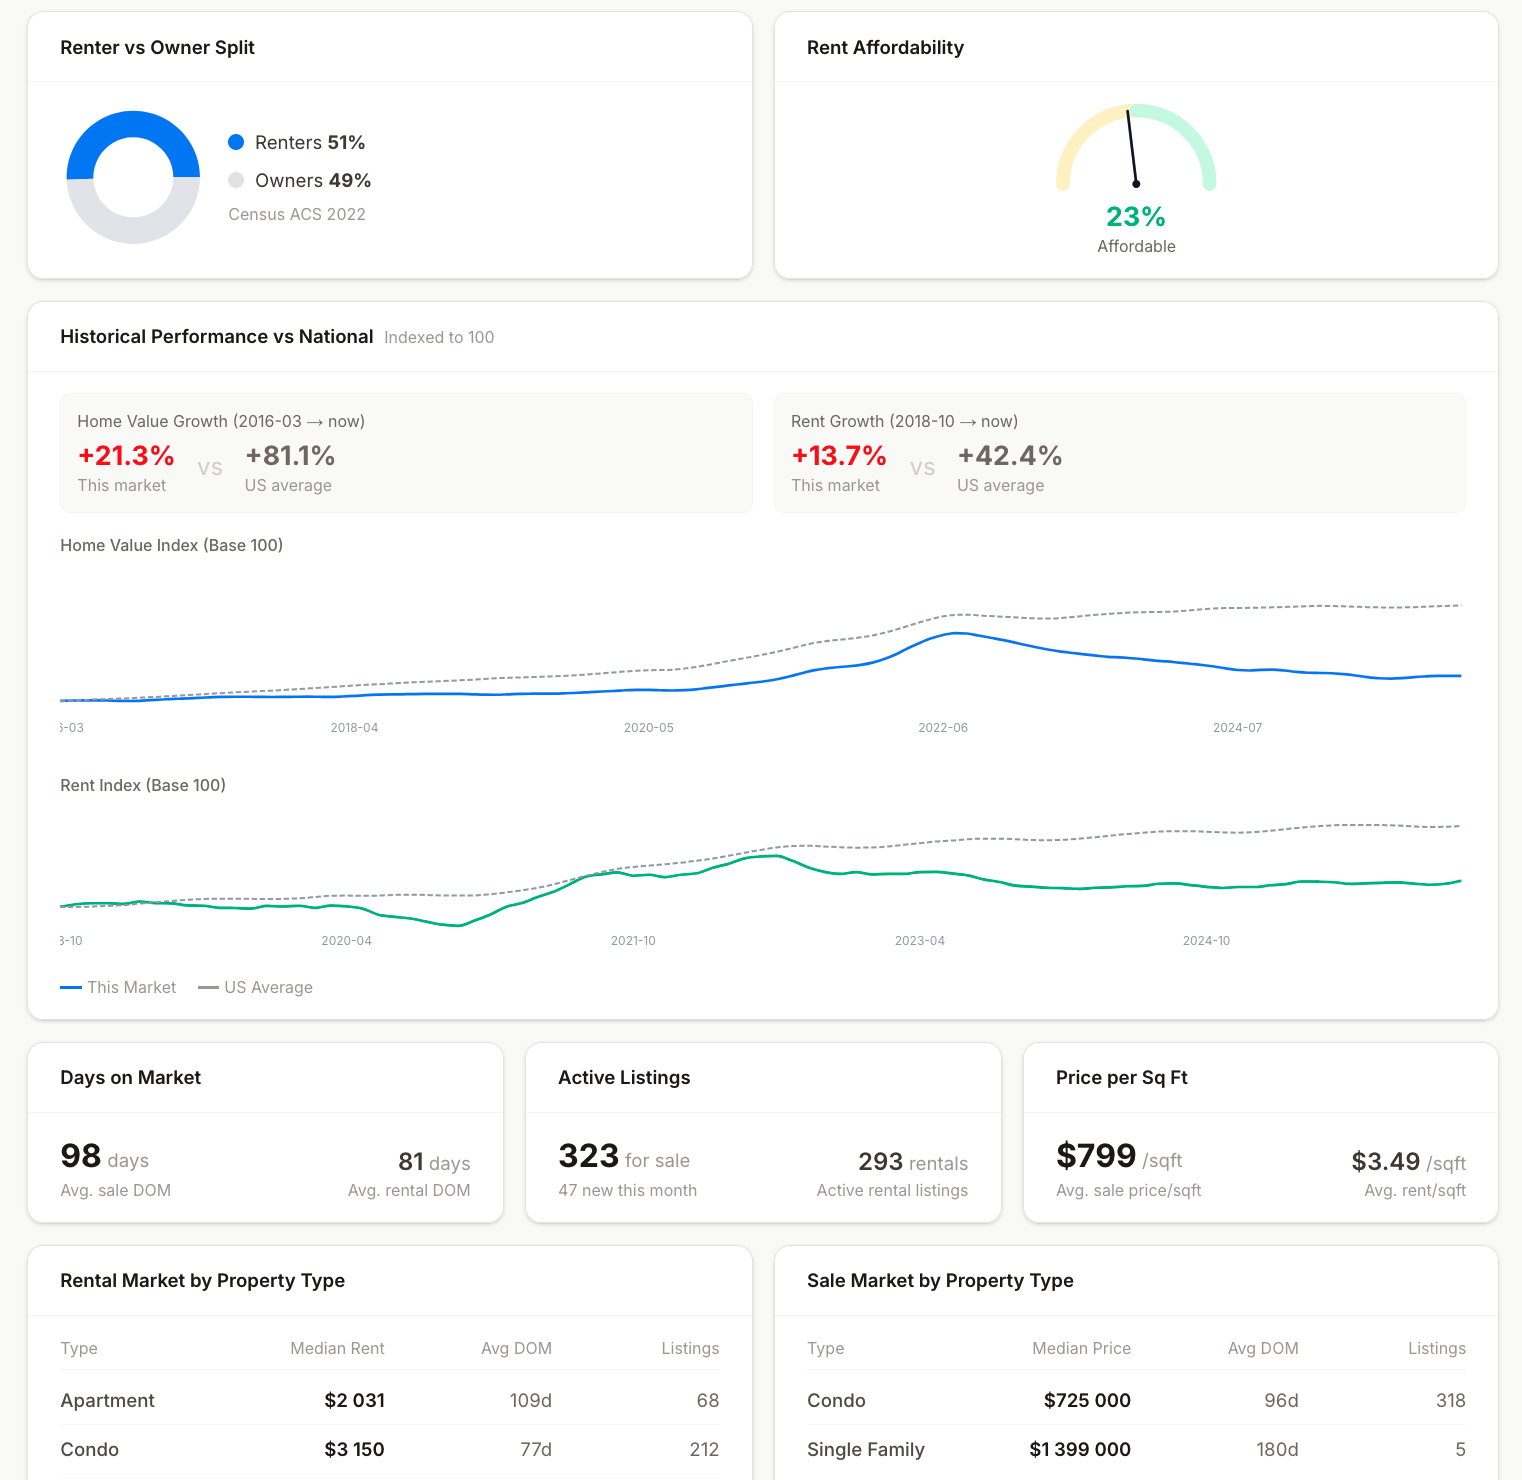
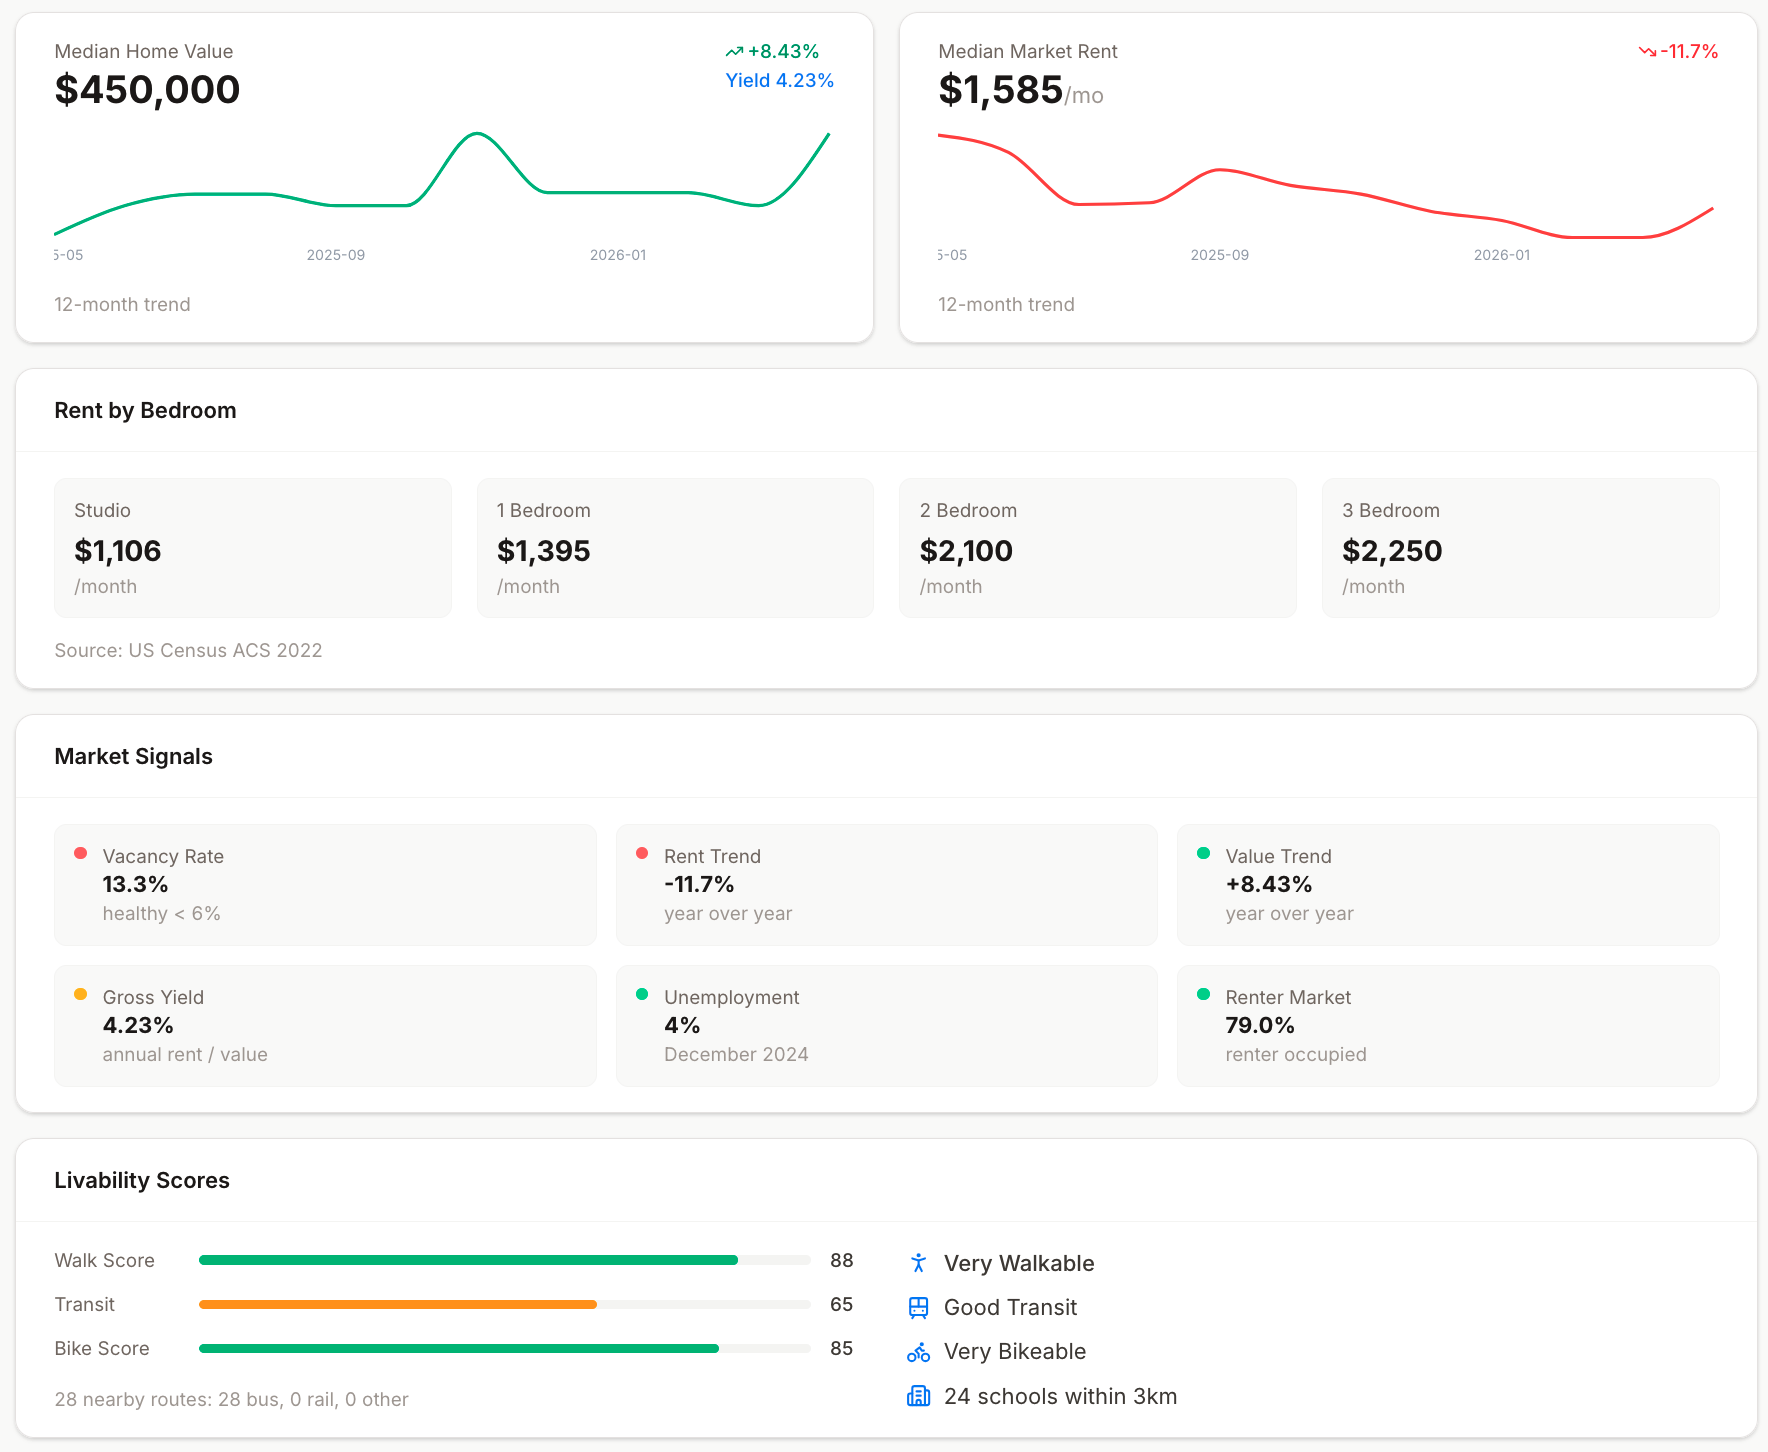
Deep market analysis for any US zip code
Enter any zip code and get a full institutional-grade report in seconds. Prices, rents, vacancy, employment, livability, crime, supply pipeline, and a detailed investment verdict.
- 24-month price and rent trend charts
- Market cycle position — Expansion, Plateau, Contraction
- Vacancy rate vs national benchmark
- Walkability, transit and bike scores
- Crime index and supply pipeline
- Rent affordability gauge
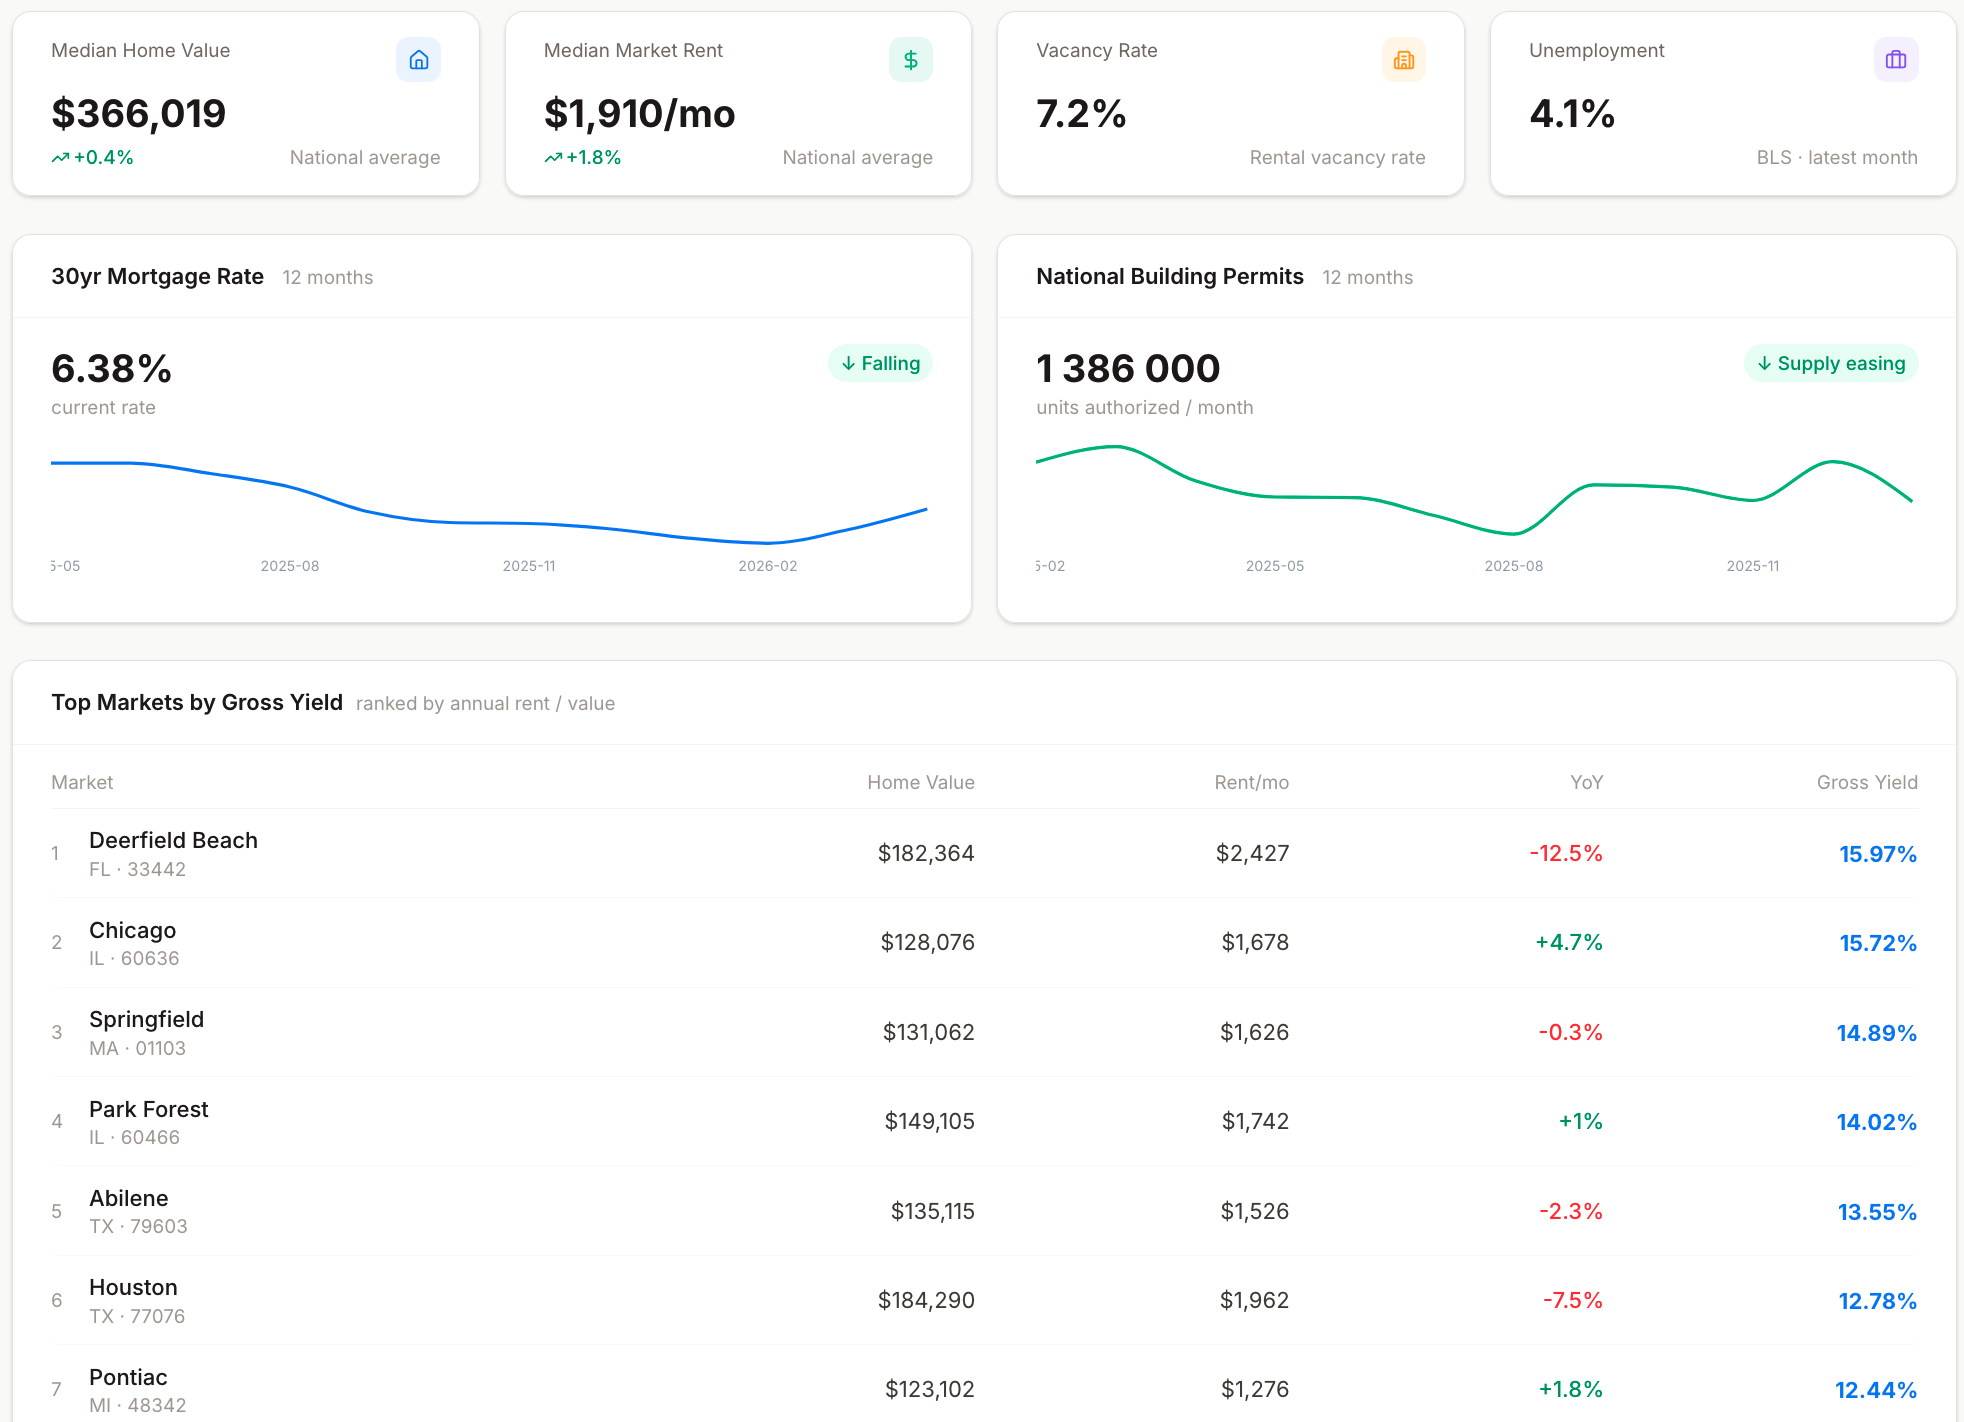
See the macro picture before picking markets
Track national home values, rents, vacancy rates, mortgage rates, and building permits in one view. See the top-yielding markets across the entire US, ranked by gross yield.
- National median home value and rent trends
- 30-year mortgage rate history
- National building permits pipeline
- Top 20 markets by gross yield, updated monthly
Model any deal in under a minute
Enter a property address and purchase price — we calculate cashflow, cap rate, cash-on-cash return, DSCR, and a 5-year projection. Get a clear BUY / HOLD / PASS verdict with full reasoning.
- Full monthly cashflow waterfall
- Cap rate, cash-on-cash, GRM, DSCR
- 5-year value and equity projection
- Paste any listing to auto-fill the form
- BUY / HOLD / PASS verdict with reasoning
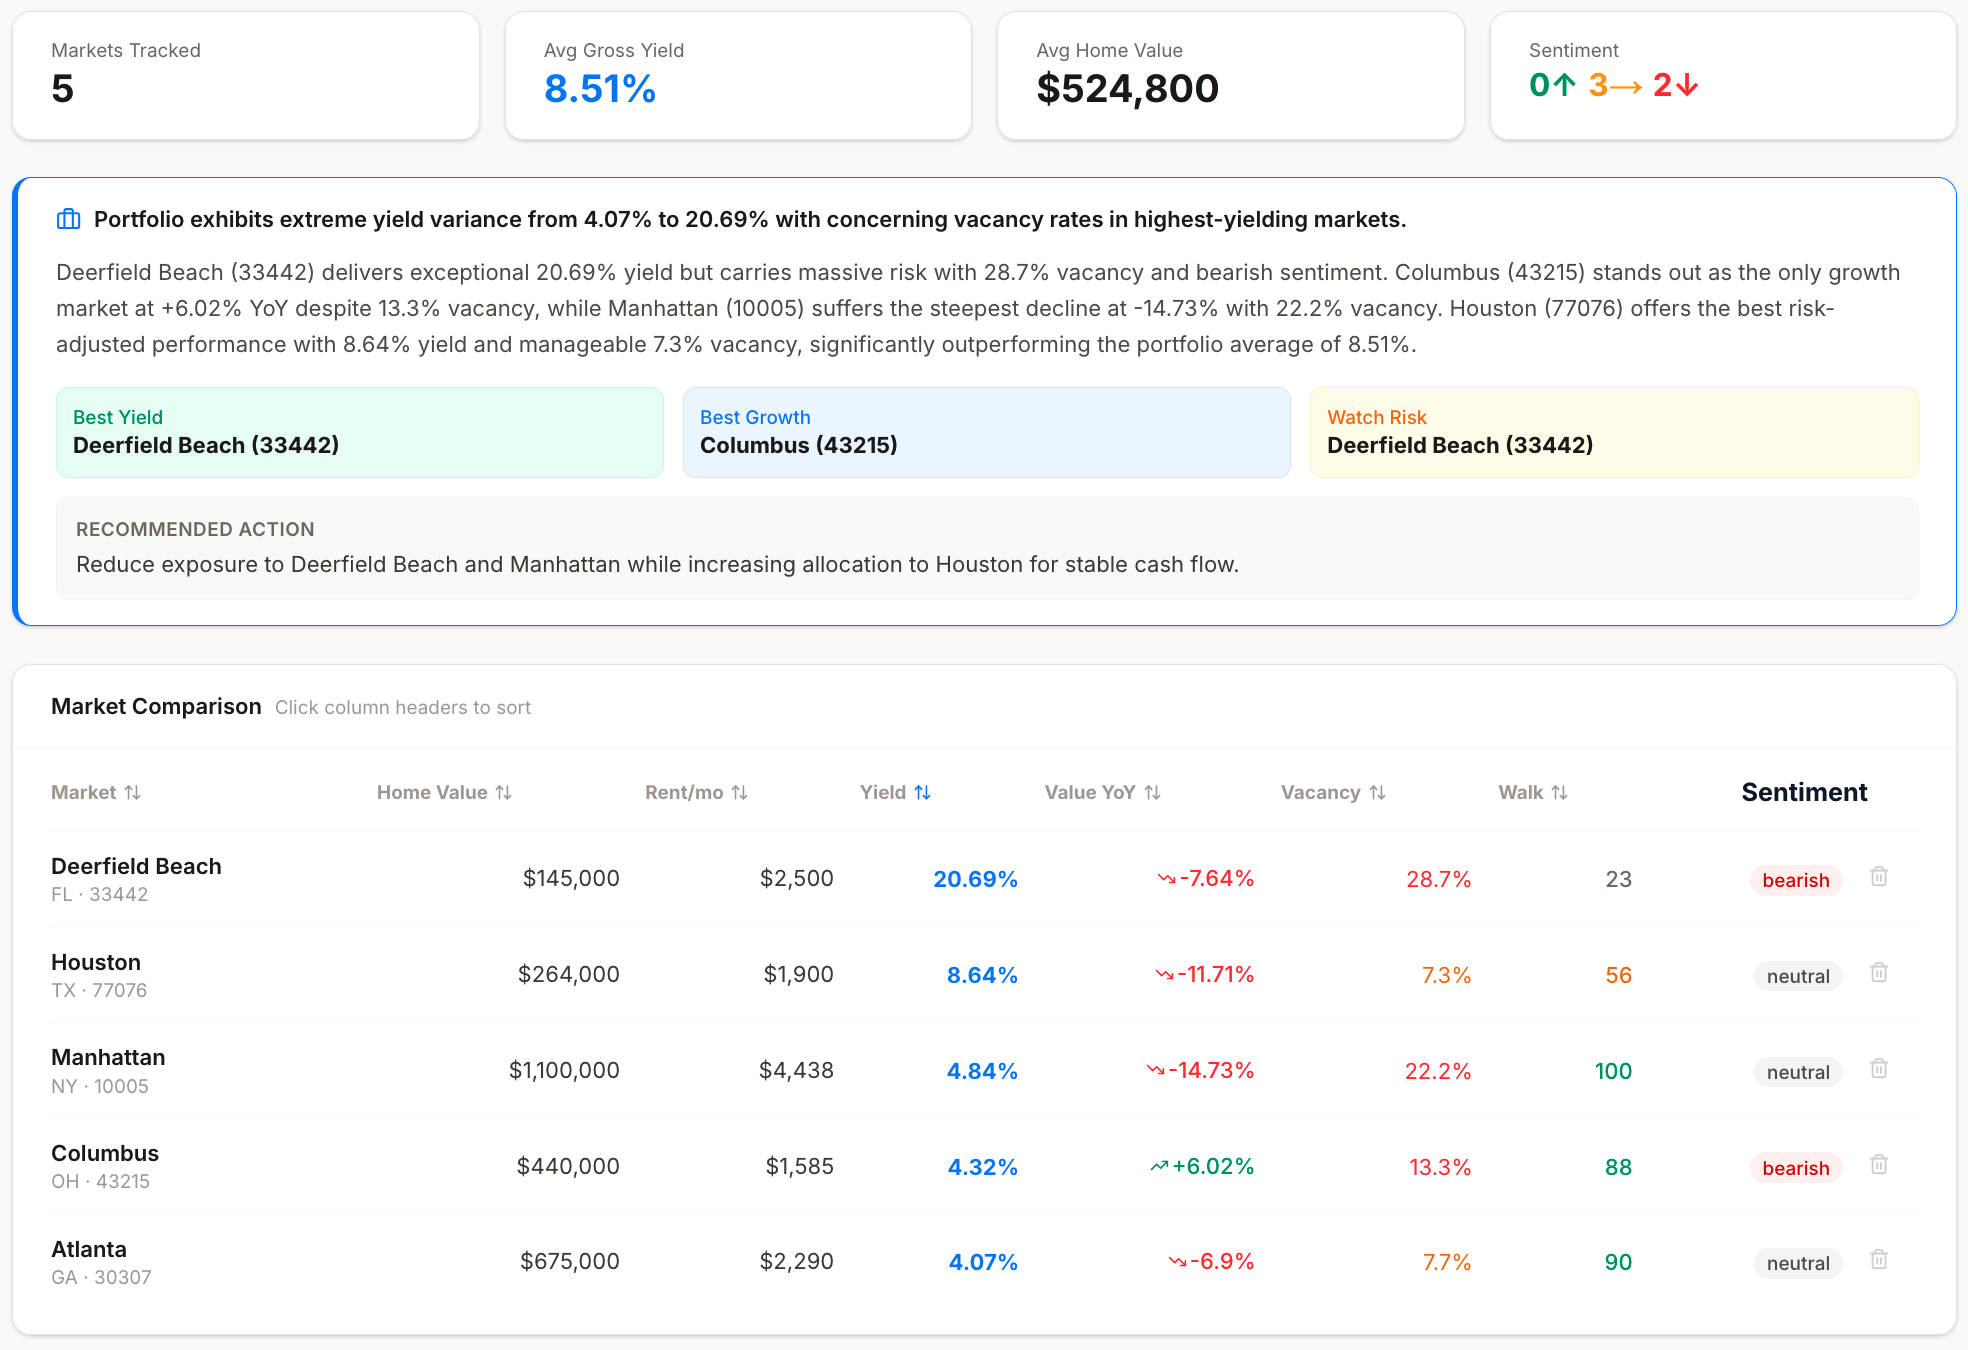
Track and compare markets side by side
Save markets to your portfolio and compare them in a single table — yield, vacancy, rent growth, walk score, sentiment. Get an instant portfolio analysis highlighting the best yield, best growth, and highest risk in your watchlist.
- Side-by-side market comparison table
- Sortable by yield, vacancy, growth, walkability
- Portfolio-level analysis and recommendations
- Track up to 20 markets on Executive plan
Find markets in plain English
Describe what you're looking for — we search 26,000+ markets to find the best matches. "Best cashflow markets in Ohio under $200K" or "High yield Sun Belt markets with positive rent growth" — just ask.
- Natural language market search
- Filter by state, price, yield, rent growth
- Results ranked by your criteria
- Instant market insight on results
Search
"Best cashflow markets in Ohio under $200K"
10 markets found · Top yield: 18.75% · Toledo, OH
Search
"High yield Sun Belt markets with positive rent growth"
10 markets found · Top yield: 15.97% · Deerfield Beach, FL
Search
"Affordable markets in Florida with strong employment"
10 markets found · Top yield: 11.12% · Fort Lauderdale, FL
From question to decision in minutes
No spreadsheets. No subscriptions to 5 different tools. One platform.
Search any market or describe what you need
Type any US zip code for an instant deep-dive, or use plain English to find markets that match your criteria across 26,000+ zip codes.
Example searches
Get a full institutional market brief
Every report covers the complete picture — not just prices, but everything that drives investment returns.
Price & rent trends
24-month charts
Vacancy rate
vs national benchmark
Supply pipeline
New permits by state
Market cycle
Expansion to Contraction
Historical performance
10yr vs national
Investment verdict
Bullish / Neutral / Bearish
Run the numbers on any property
Enter a purchase price — or paste any listing — and get a complete investment model with a clear verdict.
Monthly cashflow
+$502/mo
Cash-on-cash
15.06%
Cap rate
9.00%
DSCR
2.3x
Track and compare your target markets
Save markets to your portfolio, compare them side by side, and get an instant analysis of your watchlist.
Who is Viadomus for?
Between free consumer tools and $50,000/yr enterprise platforms
Free tools like Zillow give you basic price data. Enterprise platforms like CoStar cost thousands per month. Viadomus gives independent investors institutional-grade intelligence — vacancy rates, supply pipeline, crime data, historical performance, deal analysis — at a price that makes sense.
Free tools
Basic price data only. No rental analysis, no market signals, no investment verdict.
Viadomus
Full institutional brief — prices, rents, vacancy, supply, crime, deals, portfolio.
Enterprise platforms
Same data depth but $5,000–$50,000/yr. Built for institutions, not individuals.
Simple, transparent pricing
Institutional data at a fraction of enterprise cost.
Free
Get a feel for the platform
- National market overview
- Market Finder (1 search/mo)
- 1 market report/month
- 1 deal analysis/month
Analyst
For active investors evaluating markets
- 25 market reports/month
- 15 deal analyses/month
- Market Finder (10 searches/mo)
- Portfolio tracker (5 markets)
- Historical charts
Executive
For serious investors who need everything
- 500 market reports/month
- 200 deal analyses/month
- Market Finder (100 searches/mo)
- Portfolio tracker (20 markets)
- PDF export
- API access (2,000 / 1,000 / 500 calls/mo)
Start investing with better data
Join investors who use Viadomus to find markets, evaluate deals, and track their portfolio — all in one place.
No credit card required · Free plan available